
I have spoken about Core Web Vitals previously, in regards to the updates rolling out and what Google’s people were saying about them.
Google, as you will be well aware, is very focused on the user experience (UX). User experience is measured through Google’s Page Experience Signals, and this is where Core Web Vitals fall, great web design is more than just being aesthicallty pleasing.
What is measured?
- Largest Contentful Paint (LCP) – Visual Load
- Cumulative Layout Shift (CLS) – Visual Stability
- First Input Delay (FID) – Interactivity
Mark May down in your calendar, this is when the page experience and included Core Web Vital metrics will officially be used for the ranking of pages.
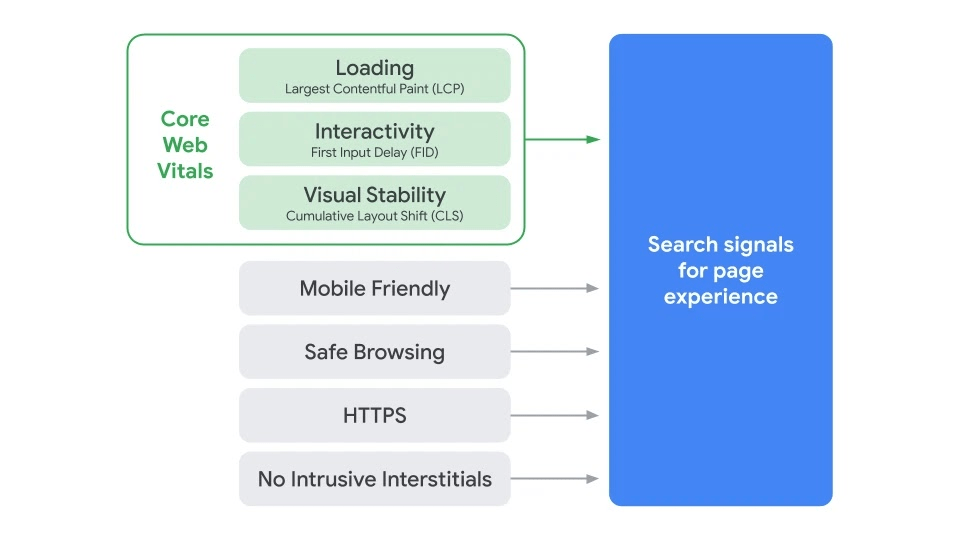
Source: Google
How To See Your Site’s Metrics
Luckily, with Google’s rules, come Google’s tools. You can check the metrics of your site easily with the Core Web Vital report in Google Search Console.
The report will tell you the status of your pages:
- Poor URL’s
- URL’s Need Improvement
- Good URL’s
https://www.duplichecker.com/
You can always delve deeper into the report and view any of the issues that are presented in more detail so as to start taking the steps to correct them.
Are Core Web Vital Important To SEO?
There are so many factors considered in ranking, over 200 in fact. So it is highly unlikely that a huge amount of weight will be given if Core Web Vitals are improved. But with SEO, everything counts and works together, so it will not hurt you to have this in check.
Core Web Vitals – A Closer Look
Largest Contentful Paint (LCP)
LCP is the largest element loaded in the viewpoint.
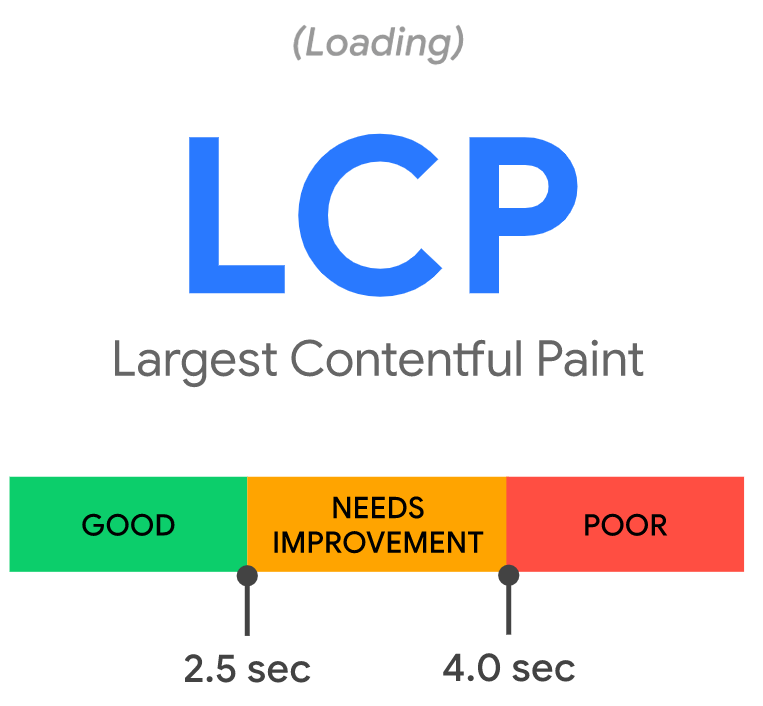
Source: web.dev/vitals
The largest element is usually going to be a featured image or maybe the <h1> tag but could be any of these:
- <img> element
- <image> element inside an <svg> element
- The image inside a <video> element
- Background image loaded with the url() function
- Blocks of text
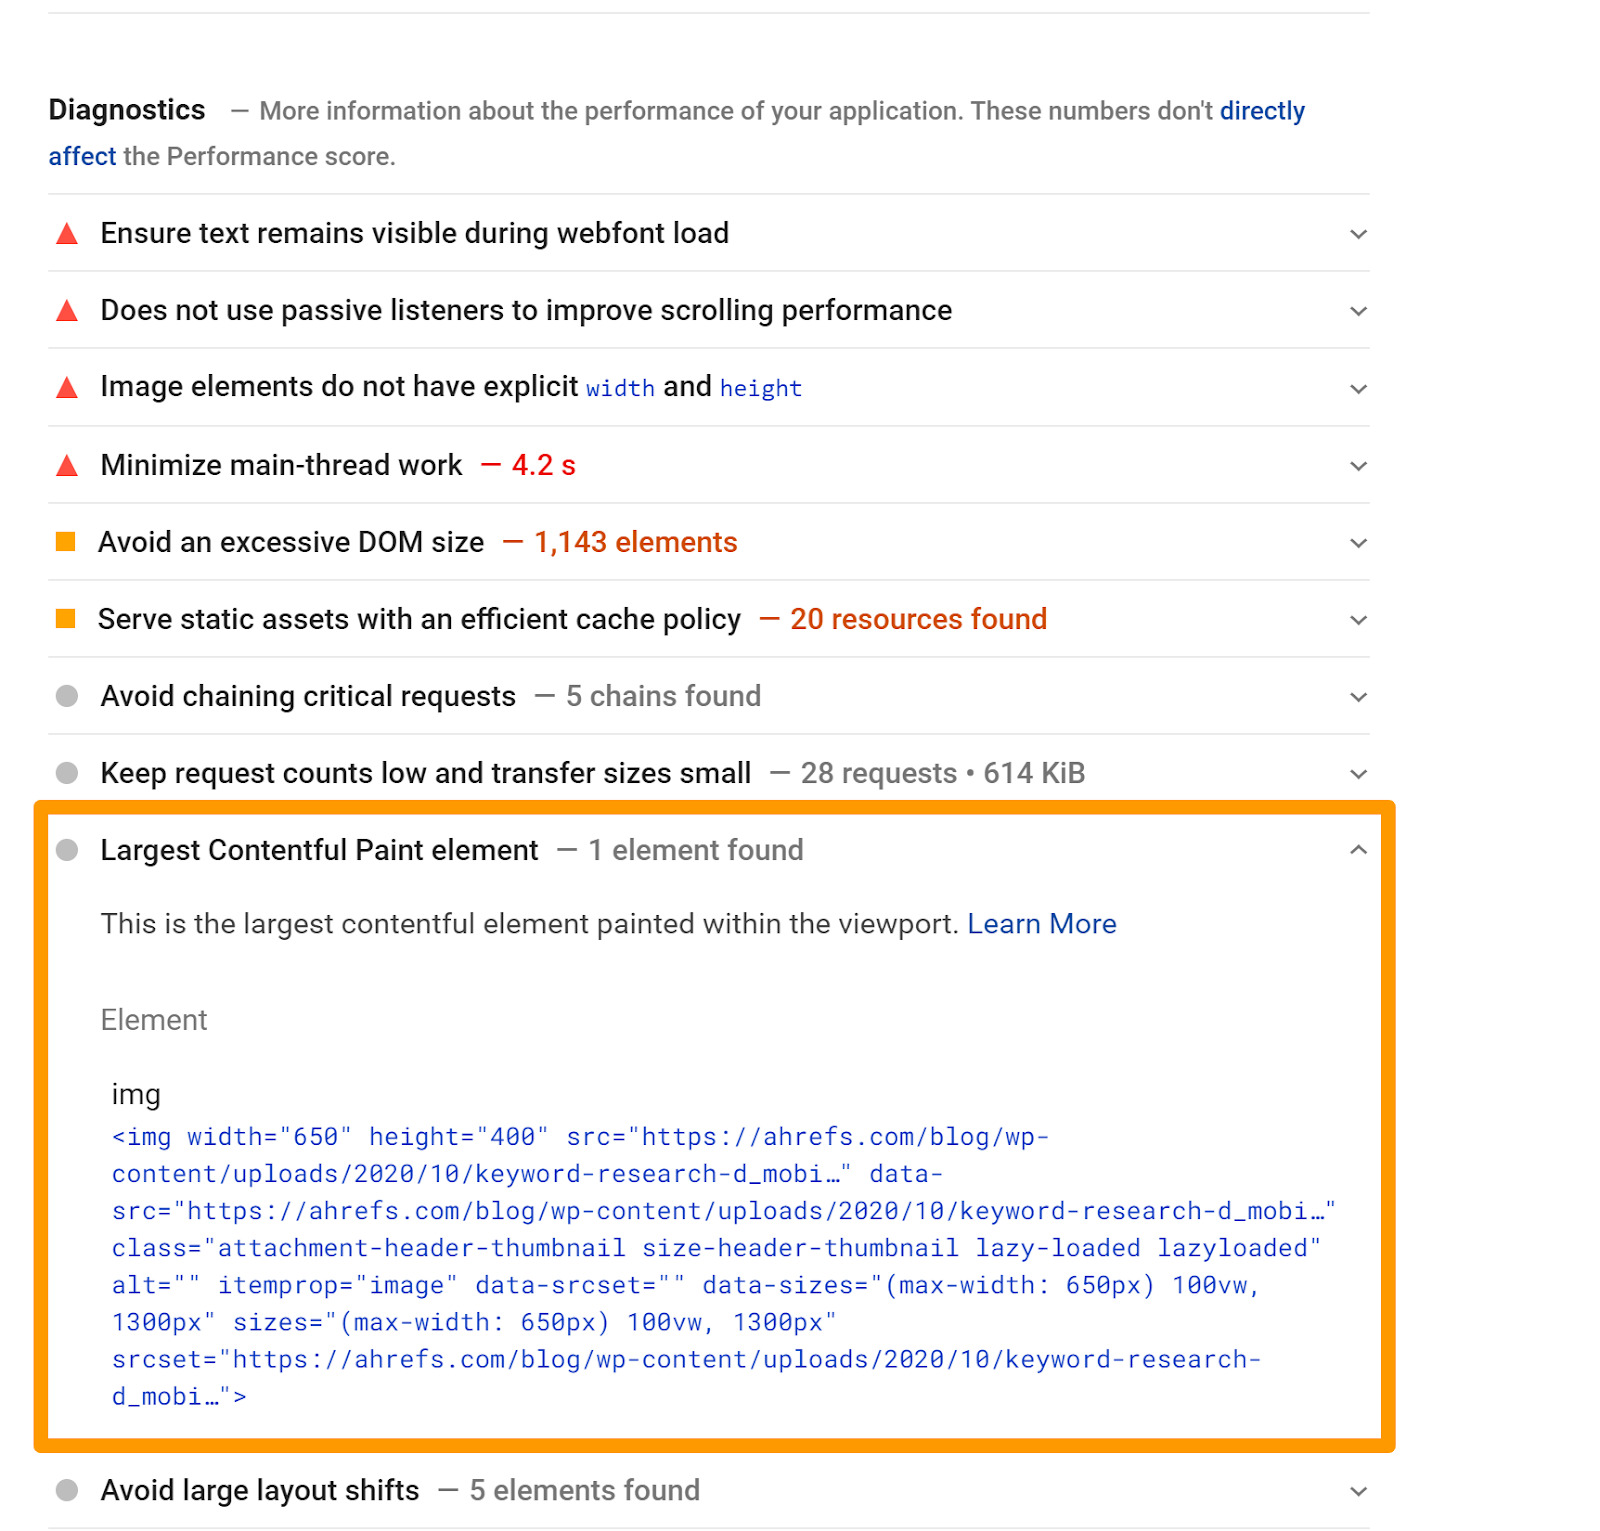
How To Find Your LCP
When you look at PageSpeed Insights, the LCP element will be clearly marked out in the diagnostics section.
PageSpeed Insights >> Diagnostics section: The LCP element will be specified. For the testes page: the LCP is our featured image on the blog post.
How To Optimise LCP
On a lot of pages, as I said previously, the LCP is likely to be the featured image. To improve on this load time, preloading is a great option or to inline the whole image to make sure that the image downloads alongside the HTML code.
Cumulative Layout Shift (CLS)
CLS measures the elements that move around, pretty much how stable the page layout is.
It takes the size of the content and the distance it moves into consideration.
There are some issues with this metric and Google are taking feedback, which means that it is likely that we will see some changes to this in the future.
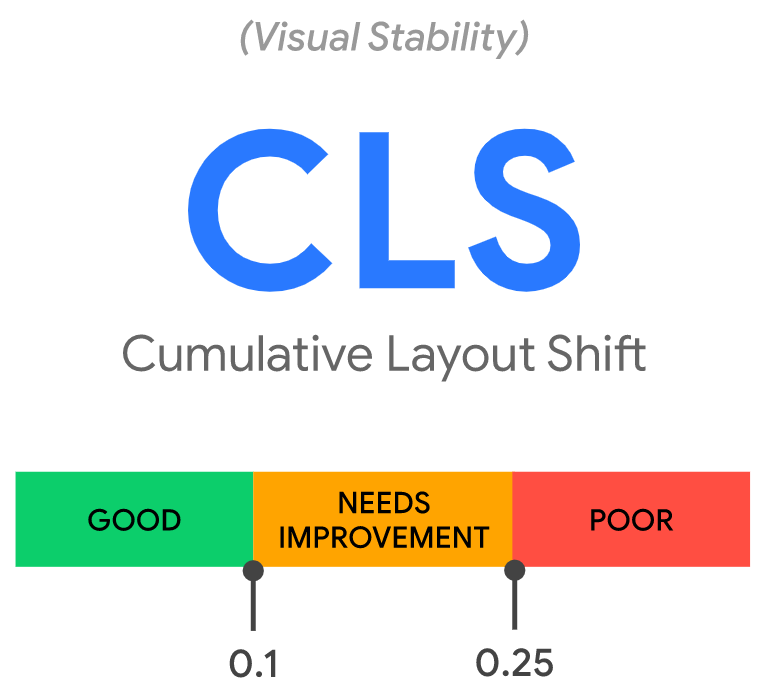
Source: web.dev/vitals
Have you ever clicked on something on a page and then a sudden shift happens adn you click something else? Suddenly you end up off on an unplanned adventure to an unknown webpage. I can say as a user myself that it is irritating
What Causes CLS?
- Images without dimensions
- Applying fonts or styles late in the load
- Injecting content with JavaScript
- Ads, embeds, and iframes without dimensions
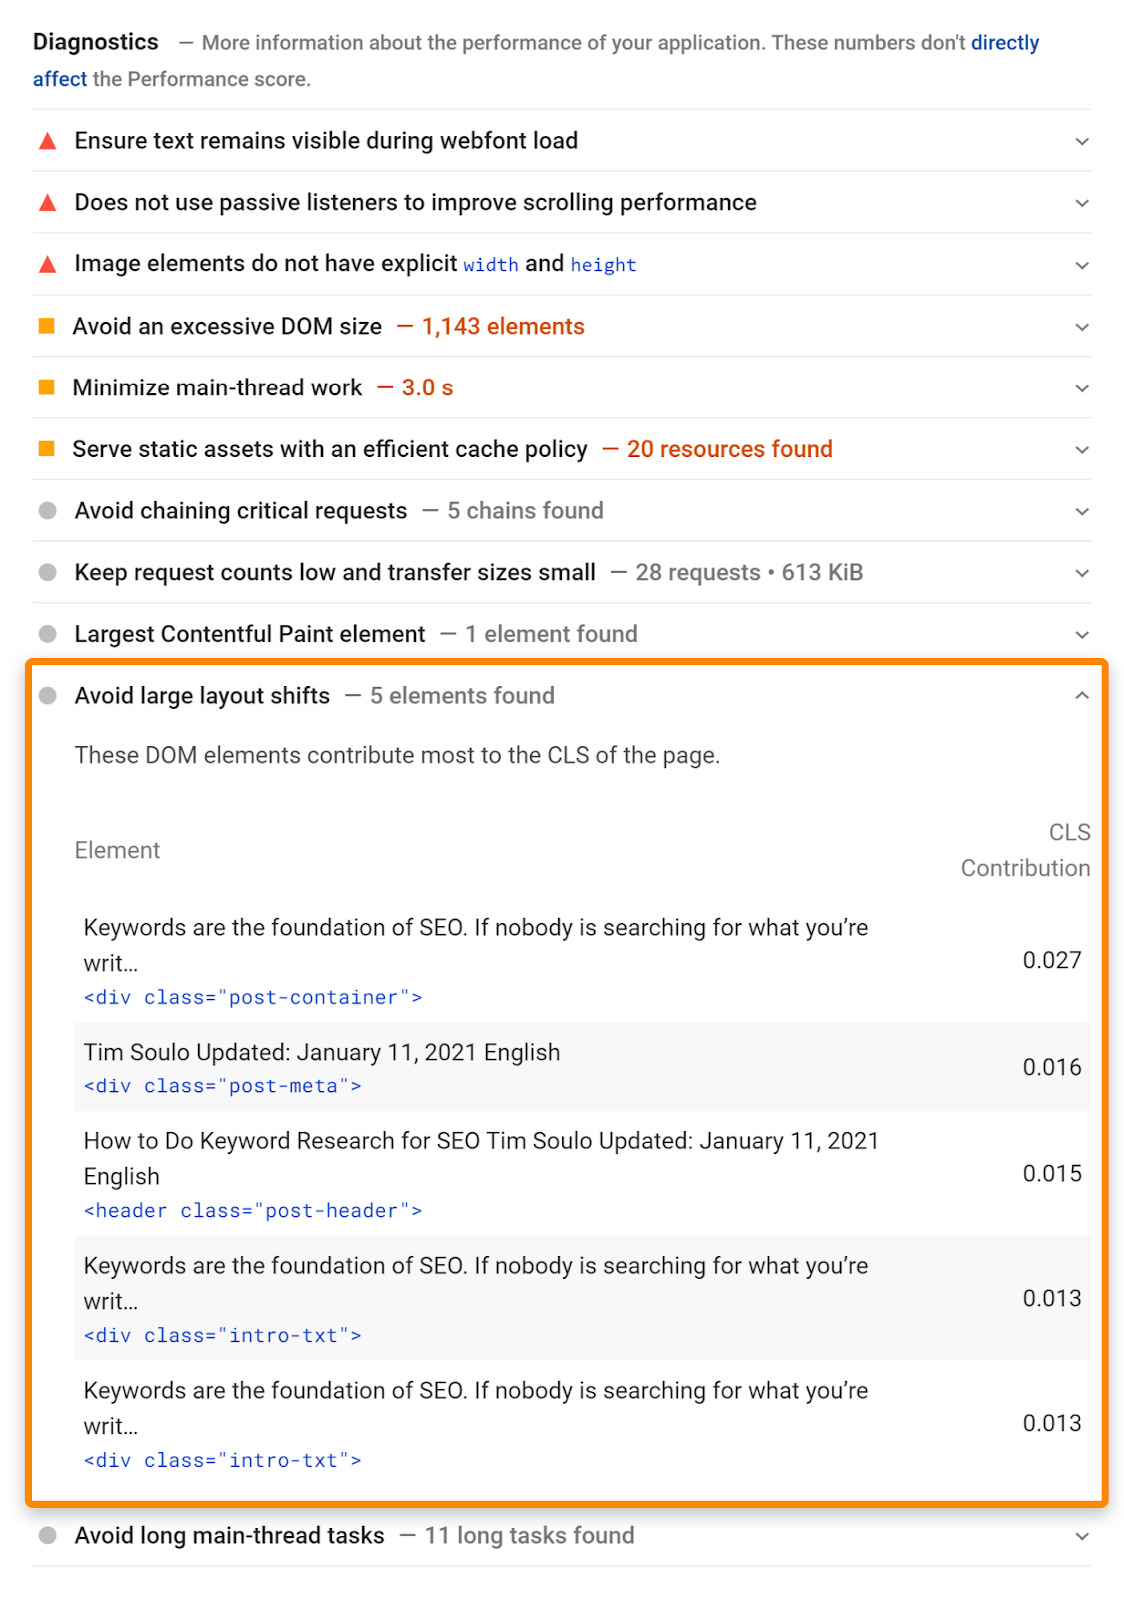
How To Find CLS Issues
PageSpeed Insights >> Diagnostics: You will find a list of the elements that are shifting.
How to Optimise CLS
There are many options for increasing the speed at which a page loads. Changes in fonts, ensuring images all have correct dimensions. Always use your tools if you are experiencing issues and you will be able to quickly find and diagnose your issue.
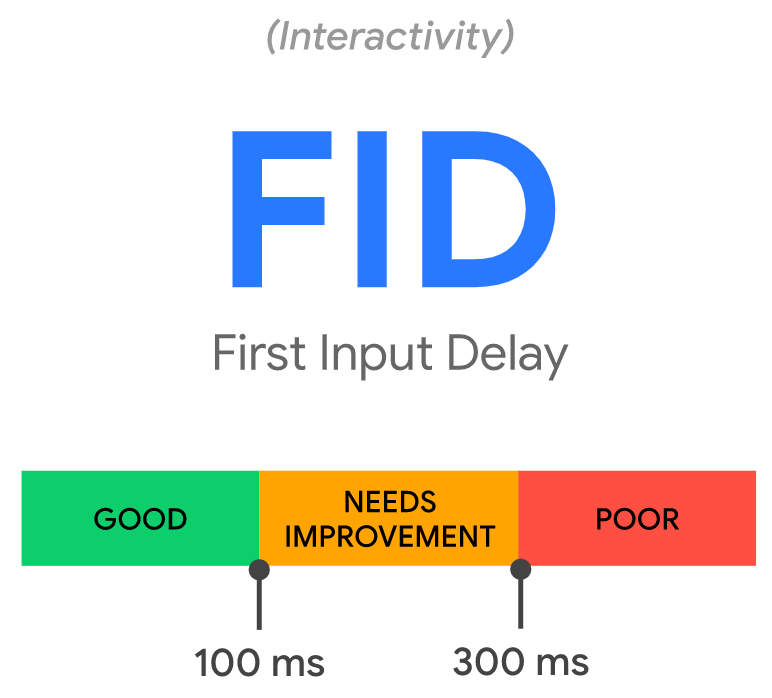
First Input Delay (FID)
FID is the time from when a user interacts with your page until the page responds. Simply, this is a page responsiveness.
Example interactions:
- Clicking on a link or button
- Clicking a checkbox.
- Drop-down menus
- Inputting text into a blank field
You will know as a user yourself that it is very irritating when you are clicking and nothing is happening.
Source: web.dev/vitals
Not all users will interact with a page, so they may not have an FID value. This is also why lab test tools won’t have the value because they’re not interacting with the page. Use Total Blocking Time (TBT) instead.
Causes of FID
JavaScript has to compete for the main thread, it competes to run tasks on it.
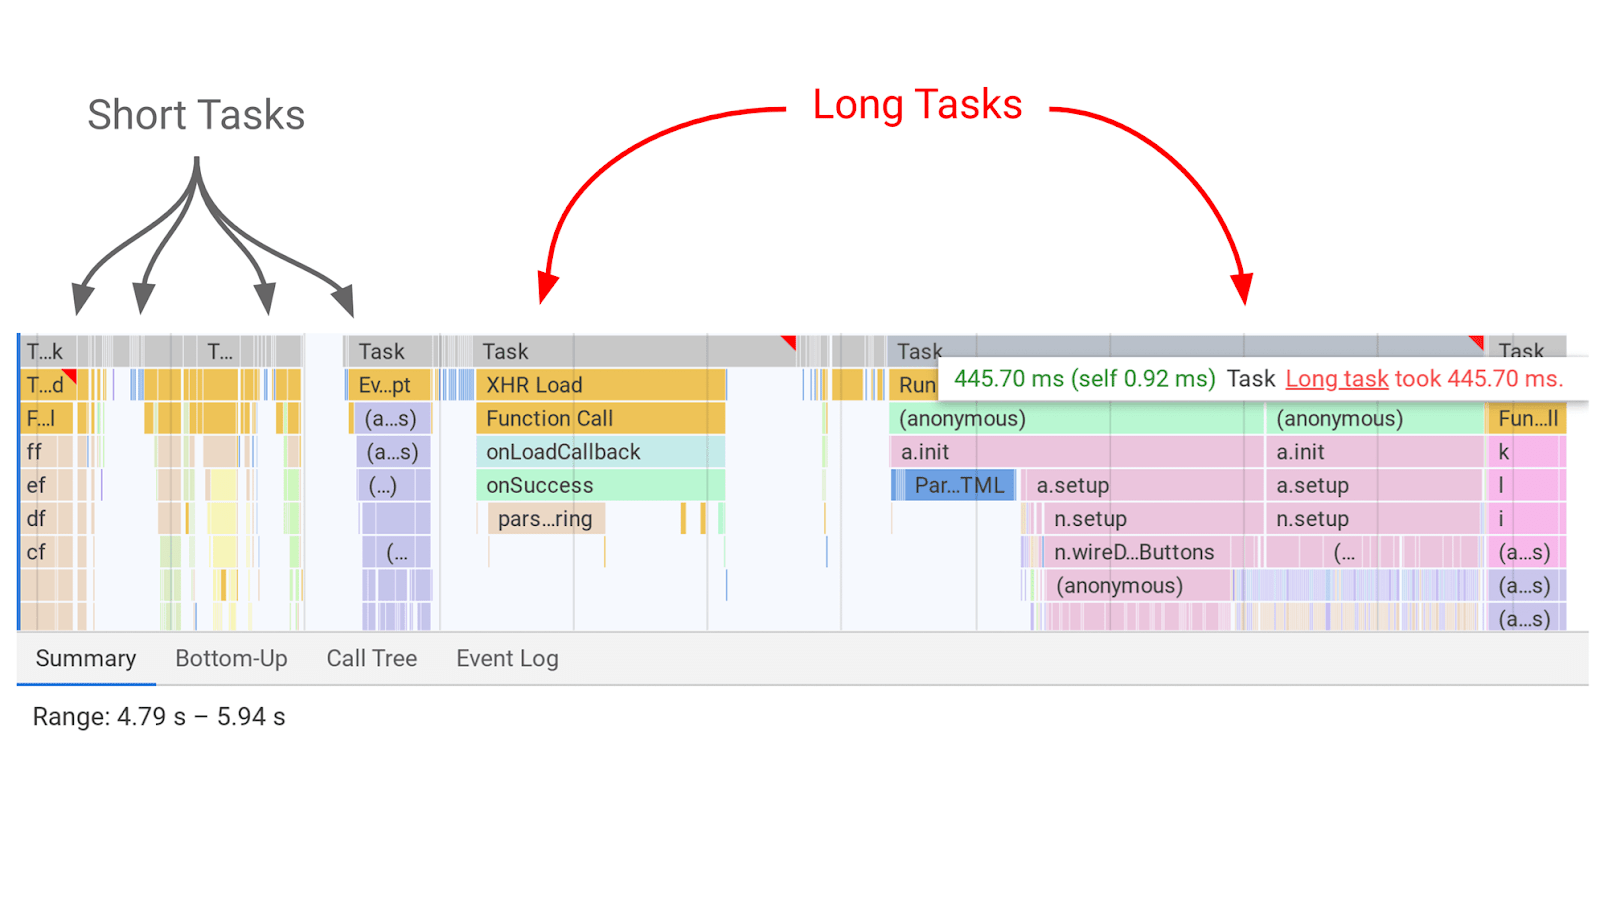
Source: https://web.dev/long-tasks-devtools
While there is a task running, if a user is interacting or inputting, the page cannot respond. This is where a user might experience a delay on the website.
Optimising FID
The loading of JavaScript. It is the breaks in between the JavaScript tasks that give the page the opportunity to switch to the users task and respond to what they wanted to do.
Most users will not even know when they click on a link that this is happening, that is until it takes more than 3 seconds to load – patience is not a strong point these days.
Deferring Javascript is an option in this case to make sure that the user does not know.
The method I’m going to talk about is the “DEFER” method. You could add the “defer” attribute to each of your external <script src=’…’></script> tags.
An example of what this would look like would be:
<script defer src=”https://ajax.googleapis.com/ajax/libs/jquery/3.2.1/jquery.min.js”></script>
What deferring does is let the web browser know not to load the JavaScript until the HTML has finished loading.
If you’re trying to satisfy the Google PageSpeed this is one of the better methods.
Final thoughts
You should improve your Core Web Vitals so that your users in turn have a better experience overall. In terms of SEO, we will have to wait and see in May exactly what the impact will be.
Page speed can be extremely complex, but there are so many ways to track this and come out on top. And of course, the complete saviour, the god like Plugin’s, that thankfully does the majority of the work for us, our favourite would be WP Rocket.